
Minimum wage hikes do show up at the register, most clearly at the drive-thru. But federal data show they are one ingredient in a bigger recipe. Wages at every step of the supply chain matter, and Washington’s pandemic spending mattered more.
Affordability is the issue of the moment. Since January 2019, overall consumer prices are up 34.1%, groceries are up 33.8% and restaurant meals are up 43.0%, according to the Bureau of Labor Statistics’ Consumer Price Index (through October 2026). A common explanation is that years of minimum wage hikes made every product more expensive to make, move and sell. First Feed News went through the federal data and the research to see how much of that holds up.
First, who actually raised the minimum wage?
The federal minimum has not moved under Presidents Obama or Biden. It has been $7.25 an hour since July 24, 2009, under the Fair Minimum Wage Act of 2007, which President George W. Bush signed (U.S. Department of Labor). Obama called for $9 in 2013 and then $10.10, and Congress passed neither. Biden pushed $15. On March 5, 2021, the Senate rejected Sen. Bernie Sanders’ $15 amendment to the American Rescue Plan 42-58, with seven Democrats and independent Angus King joining all 50 Republicans (Senate roll call vote 74).
The only federal raises came by executive order for federal contractors. Biden’s $15 contractor order (EO 14026) was revoked by President Trump on March 14, 2025 (Federal Register). Obama’s older order still applies at about $13.30.
The real hikes came from states and cities. As of 2026, 17 states and D.C. have a minimum of $15 or more. About 66.4 million workers live in those states, more than the 60.2 million in states still at $7.25, according to the labor-backed Economic Policy Institute’s tally (EPI). California’s general minimum is $16.90, and large fast-food chains there have paid at least $20 since April 1, 2024.
Labor is in every step of your grocery bill
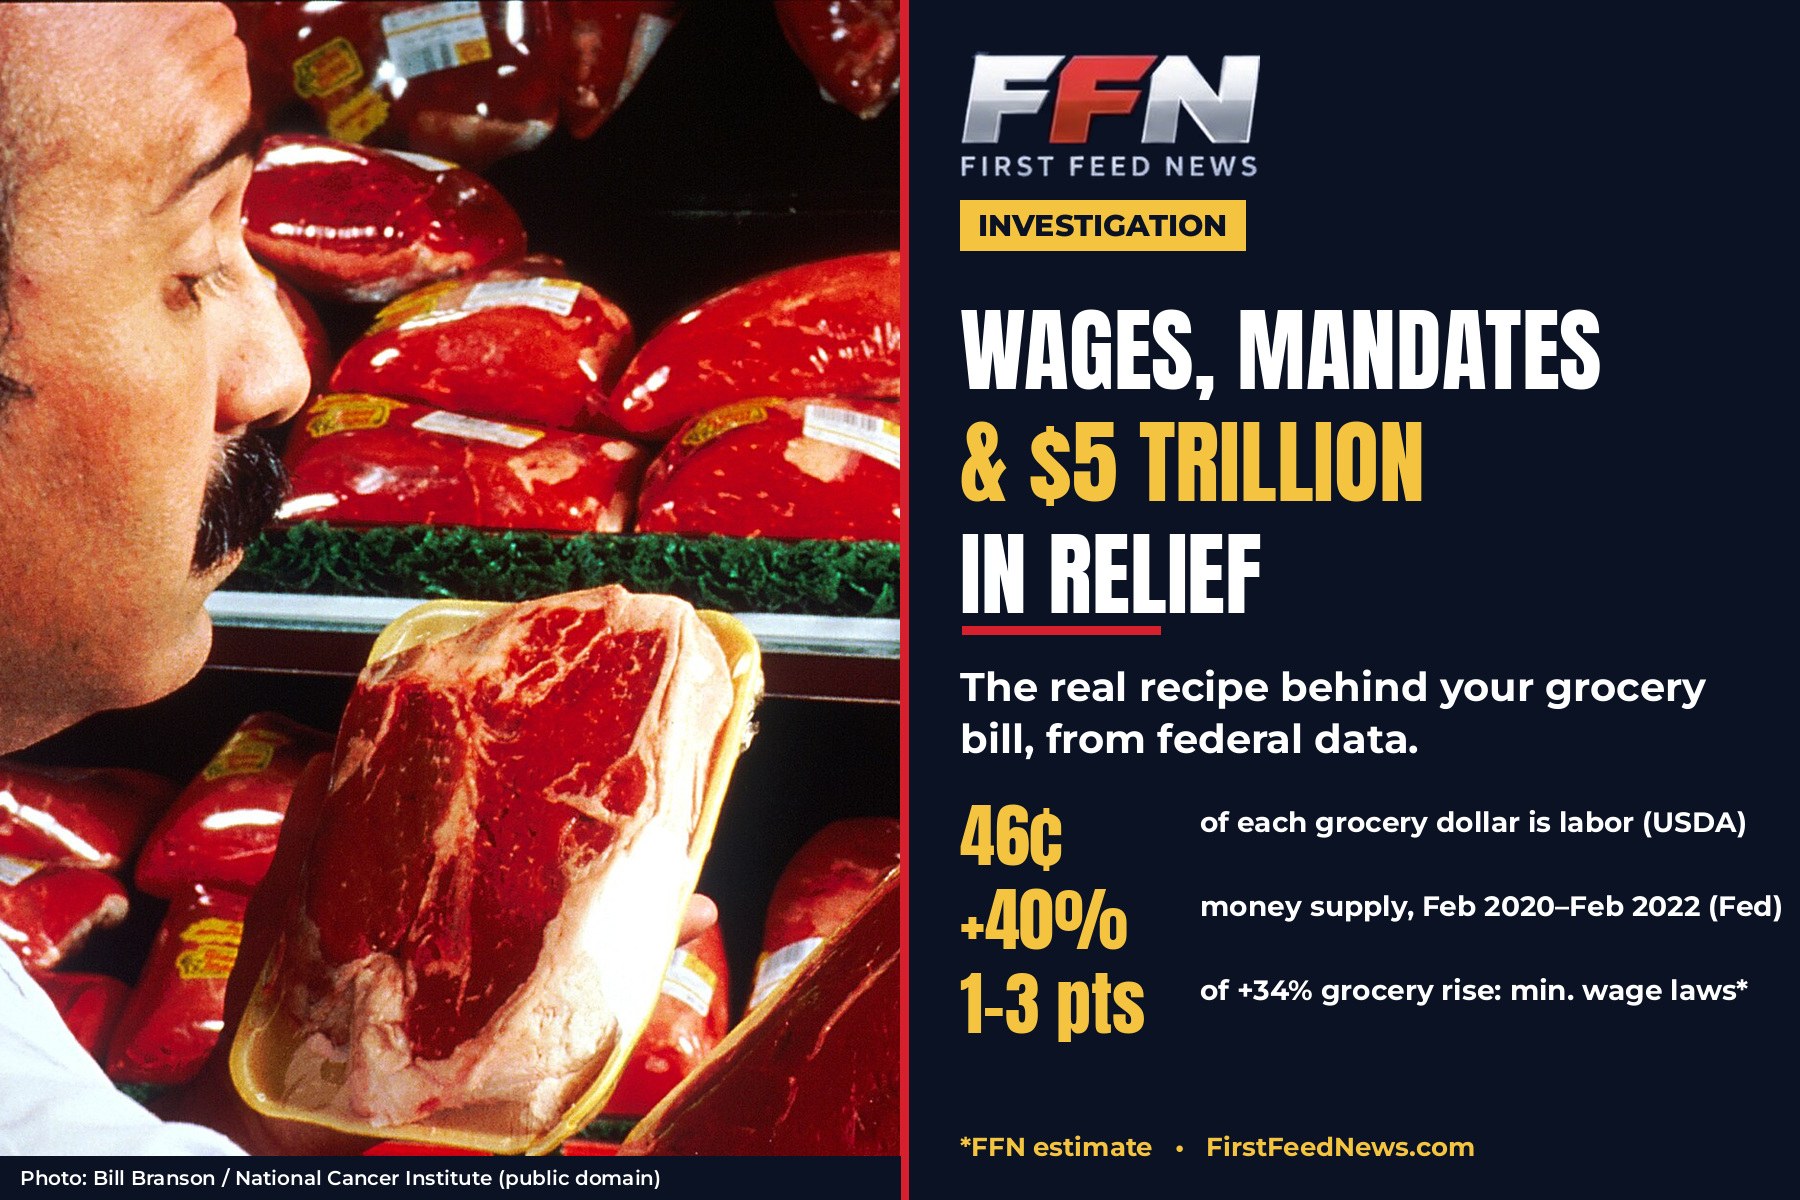
The U.S. Department of Agriculture’s Economic Research Service breaks every food dollar into who gets paid. In 2023, 45.5 cents of each grocery-store dollar went to wages and benefits somewhere in the chain (USDA ERS Food Dollar Series):
| Step in the chain | Labor, cents per grocery dollar (2023) |
|---|---|
| Grocery store (retail) | 14.0¢ |
| Wholesale and warehousing | 10.2¢ |
| Food processing | 8.6¢ |
| Trucking and transportation | 2.9¢ |
| Farm production | 2.6¢ |
| Everything else (energy, finance, packaging, ads) | about 7¢ |
| Total labor | 45.5¢ |
At the store itself, labor is the biggest cost after the groceries. Kroger reported in its fiscal 2021 annual report that operating, general and administrative costs, which it said consist “primarily” of wages, health care and retirement costs, were 16.8% of sales, while its net earnings were 1.2% of sales. Weis Markets says in its latest annual report that employee costs make up about 58.8% of those expenses, and that store labor as a share of sales rose “due to increased wage expenses for hourly employees.”
Pay for the people closest to the minimum rose fastest. BLS payroll data show average hourly pay at food and beverage stores went from $15.92 in January 2019 to $22.72 in 2026, up 43%, and at restaurants and bars from $14.91 to $22.13, up 48%. Prices overall rose 34% in that time.
The ripple effect is real
Raising the floor pushes up pay above it. In its March 2, 2022 Beige Book, the Federal Reserve reported that the Jan. 1 minimum wage hikes in New Jersey and much of New York “prompted many businesses in manufacturing, distribution, and leisure & hospitality to raise wages more than they otherwise would have—not just for workers at the threshold but for those somewhat higher in the wage distribution as well to mitigate wage compression” (Federal Reserve).
Studies of payroll records put a size on it. Raises spill over to workers earning up to about $2.50 above a new minimum (Gopalan, Hamilton, Kalda and Sovich, Journal of Labor Economics, 2021) or about $3 above it (Cengiz, Dube, Lindner and Zipperer, Quarterly Journal of Economics, 2019). Researchers also found that 40% to 50% of big companies’ posted wages for the same job are identical across locations, so a raise forced in one high-wage state can travel to the company’s stores nationwide (Hazell, Patterson, Sarsons and Taska, NBER).
On the farm, Washington sets its own wage floor for guest workers. The H-2A “adverse effect wage rate” went from a national average of $13.25 in 2019 to $18.12 in 2025. The Trump Labor Department wrote in October 2025 that it had been rising 5.5% a year, “far outpacing” other workers, and that it put growers at a disadvantage against Mexican farms paying about $1 to $2 an hour. The department then cut the rates (Federal Register).
Where you can see it: the menu board
Restaurants are where wage mandates show up most clearly. When California’s $20 fast-food wage took effect, Chipotle Chief Financial Officer Jack Hartung told investors on the company’s April 2024 earnings call: “Our wages in California went up by nearly 20%, and we subsequently took a 6%-7% menu price increase in our California restaurants just to cover the cost in dollar terms.”
McDonald’s USA said in May 2024 that its average menu prices had risen about 40% since 2019, roughly matching a 40% rise in crew pay and a 35% rise in food and paper costs. It put the average Big Mac at $5.29, up from $4.39 (McDonald’s).
In the year after California’s $20 law took effect, BLS data show restaurant prices in the Los Angeles area rose 5.4%, compared with 3.8% nationally. The research on the law splits along familiar lines:
- UC Berkeley’s Institute for Research on Labor and Employment, a state-funded center whose lead author has long backed higher minimum wages, first estimated menu prices rose 3.7% and later revised that to 1.5%, with no job loss (IRLE).
- The Employment Policies Institute, which is managed by the restaurant-industry PR firm Berman and Company, surveyed 182 California operators. It found 98% raised prices and 89% cut hours, and it cites menu increases of up to 10.1% (EPI).
- Economists Jeffrey Clemens (UC San Diego and the Hoover Institution) and co-authors estimate California fast-food employment ended up about 3.5% lower after two years than it would have been without the law, roughly 20,000 jobs (NBER). Arindrajit Dube of UMass Amherst estimates a far smaller loss, 0.3% to 1.4% (NBER).
Stanford economist Thomas MaCurdy, a Hoover Institution fellow, found that minimum wage costs passed on in prices act like a sales tax that falls hardest on poor households, who spend more of their income on low-wage goods such as fast food (Journal of Political Economy, 2015).
Washington’s money did even more
Then there is the money. The M2 money supply grew from $15.49 trillion in February 2020 to $21.71 trillion in February 2022, a 40% jump in two years, according to Federal Reserve data (FRED). Congress authorized about $6 trillion in COVID relief, with a net cost of “well over $5 trillion,” according to the nonpartisan Committee for a Responsible Federal Budget, which counted about $650 billion of it as unrelated to the pandemic (CRFB).
President Trump signed the first packages, the March 2020 CARES Act and the December 2020 relief bill. The one economists single out is President Biden’s $1.9 trillion American Rescue Plan of March 2021, which passed without a single Republican vote, on top of the earlier trillions.
- San Francisco Fed economists estimated U.S. relief payments “may have contributed to an increase in inflation of about 3 percentage points by the fourth quarter of 2021,” which is why U.S. inflation ran ahead of other rich countries (SF Fed).
- Jason Furman, President Obama’s top economic adviser, said the December 2020 and March 2021 packages “plausibly added between one and four percentage points to inflation” in 2021, about half of that year’s overshoot (Brookings transcript).
- Fed Chair Jerome Powell said in November 2022 that for services such as health care and restaurants, “because wages make up the largest cost in delivering these services, the labor market holds the key to understanding inflation in this category.” He also said the early inflation “was not really related to wages at all” (Federal Reserve).
Prices have had other push factors since then. Walmart CEO Doug McMillon told investors in May 2025 that “the higher tariffs will result in higher prices.”
What the ‘wages did it’ argument overstates
- Truckers, warehouse and factory workers mostly kept pace with prices; their pay didn’t double. From January 2019 to 2026, average hourly pay rose 35% in trucking, 32% in warehousing and 36% in manufacturing (BLS), against 34% inflation. Most of those jobs pay well above any minimum. Heavy-truck drivers earn a median of about $27.62 an hour (BLS).
- The 2021-23 pay surge wasn’t mainly about mandates. MIT’s David Autor and co-authors found that after 2020, pay at the bottom rose just as fast, or slightly faster, in states that never raised their minimum. They point to the labor shortage instead (NBER).
- Labor’s share of the grocery dollar fell. It dropped from 48.5 cents in 2019 to 45.5 cents in 2023, while the share going to owners and capital (profits, interest, depreciation and rent) rose from 43.1 to 45.7 cents (USDA ERS).
- Labor costs moved overall inflation only a little. A San Francisco Fed analysis found labor-cost growth explained only about 0.1 percentage point of core inflation in early 2023, and that wages tend to follow prices rather than lead them (SF Fed).
- Produce didn’t spike. Fruit and vegetable prices rose 22.8% from January 2019 to October 2026, less than overall inflation, even as the federal farmworker wage floor rose 37% (BLS, DOL).
- Across the whole economy, the measured effect is small. A Banco de México review of 199 estimates found a 10% minimum wage hike raises prices by 0.3% to 1.1%, with bigger effects in labor-heavy businesses like restaurants (Pérez Pérez, 2026).
The bottom line, by the numbers
The figures in the last column are FFN estimates, not findings from any single study. We built them by applying the published range of price effects to the roughly 40% state minimum wage increases since 2019 in states holding about half of U.S. workers, then cross-checked them against labor’s share of USDA food-dollar growth.
| Price change, Jan. 2019 to Oct. 2026 (BLS) | Total rise | Share tied to labor costs overall | Minimum wage laws, incl. ripple (FFN estimate) |
|---|---|---|---|
| Groceries | +33.8% | About one-third (USDA, 2019-23) | About 1 to 3 points |
| Restaurant meals | +43.0% | More than half (USDA, 2019-23) | About 2 to 8 points |
| All consumer prices | +34.1% | Largest in services (Fed) | About 0.5 to 2.5 points |
| Pandemic relief (2021 alone) | About 1 to 4 points (Furman); about 3 (SF Fed) |
The verdict: Paying workers more does raise what they touch. You can see it on every menu board in California, and wage mandates do ripple up the pay scale and onto farms. But the data don’t show minimum wage laws driving the overall affordability crunch. They are a real slice of restaurant prices and a small slice of grocery prices. The bigger shove came from trillions in federal relief spending, pandemic supply shocks and a tight labor market. Tariffs have added pressure since 2025.
Sources: Bureau of Labor Statistics (CPI, Current Employment Statistics, Characteristics of Minimum Wage Workers); USDA Economic Research Service; U.S. Department of Labor; Federal Register; U.S. Senate; Federal Reserve Board and Federal Reserve Bank of San Francisco; Congressional Budget Office; Committee for a Responsible Federal Budget; company filings and earnings calls from Kroger, Weis Markets and Chipotle; McDonald’s USA; peer-reviewed and NBER research cited above. FFN estimates are labeled.





Leave a Reply